Three common mistakes in meta-analysis

Meta-analysis has become a popular tool to summarizing data from a body of work investigating a common research question. As this provides a putatively objective means of summarizing a body of data, it has become the gold standard for evidence when developing health guidelines.
However, there are several issues in meta-analysis that can contribute to inaccuracies. Due to these limitations, meta-analysis — or “mega-silliness”, to borrow a term from an early detractor — has been criticized for almost as long as the tool has been available.
There are several means to help ensure meta-analysis quality, which will be outlined later in this post. But first, let’s consider this consider this (fictitious) extract from the results section of a meta-analysis that I will use to briefly illustrate three common issues in meta-analysis:
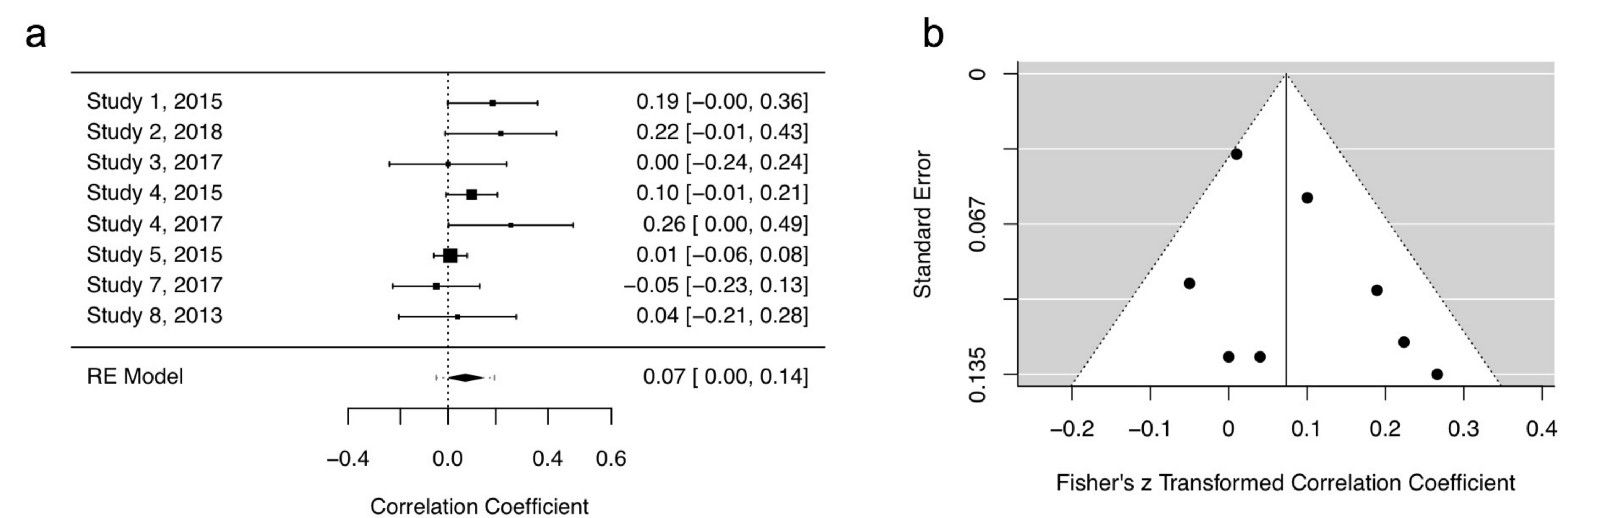
“As hypothesized, a meta-analysis synthesizing eight effect sizes from seven studies suggests that social media usage is positively associated with self-reported levels of anxiety [r = .073, 95% CI ( .004, 0.142); p = .038; Fig. 1A]. Egger’s regression test suggested no evidence of publication bias (p = .19; Fig. 1B).”
When this imaginary author — who also happens to be releasing a book on the dangers of social media — initially searched for studies, they actually found nine studies fulfilling their inclusion criteria. However, the summary effect size of this meta-analysis of nine studies [r = .062, 95% CI (- .004, 0.127)] was associated with a p-value of .061 (Figure 2).
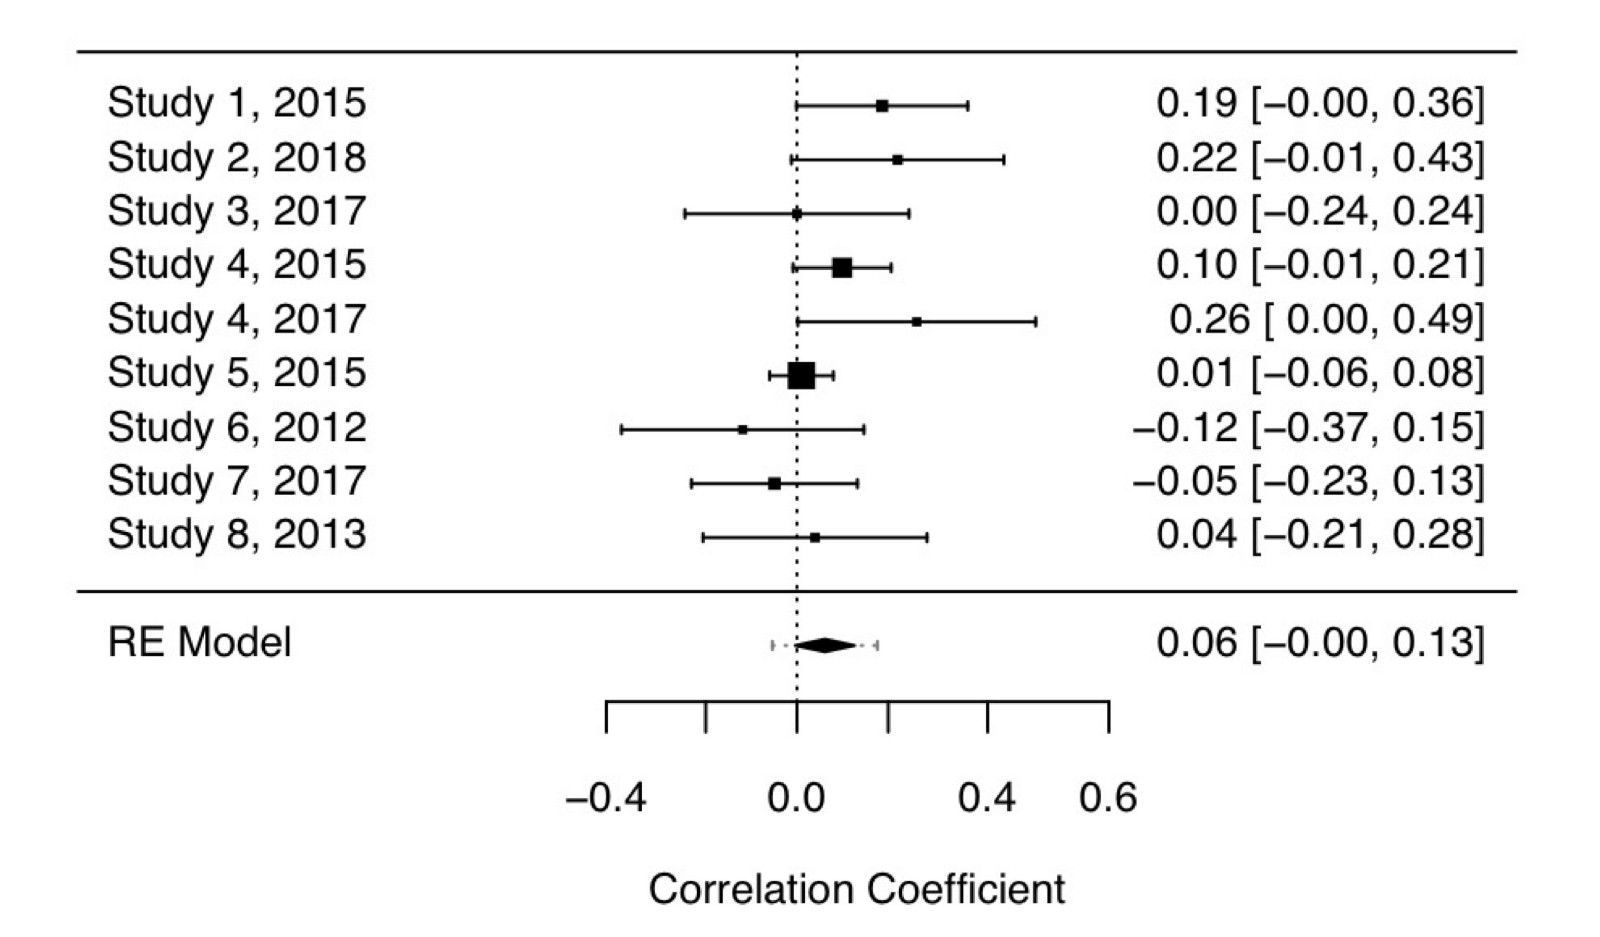
As this outcome would hinder the chances of publication (and book sales), they took a closer look at study six, which reported a negative association between social media usage and anxiety levels. This study happened to be the earliest study included in the meta-analysis.
Study six did not include Instagram usage (which became popular during 2012), so they adjusted the eligibility criteria to only include studies published from 2013 onwards, justified by a (post hoc) hypothesis that Instagram usage is most associated with anxiety.

With the removal of the study, the meta-analysis became statistically significant. While this fabricated scenario might seem extreme at first glance, almost 40% of over 2,000 surveyed psychologists admitted that they had excluded data after looking at the impact of doing so.
Pre-registering your analysis plans
Meta-analysis pre-registration provides a remedy to analytic flexibility as it provides an a priori record of the researcher’s analysis intentions. In the above example, exclusion criteria would have been specified before the analysis was conducted.
A common critique of pre-registered analyses is that they offer no flexibility for analysis. However, this is incorrect as pre-registration does not lock the researcher into a specific plan but instead helps clearly delineate pre-planned and exploratory analysis.
In the above case, the researcher would be free to report their analysis with the removal of the study, but they would have to state their reasoning, which is flimsy at best. For guidance, the Preferred Reporting Items for Systematic Reviews and Meta-Analysis protocols (PRISMA-P) document provides a list of items that should be addressed in a meta-analysis protocol.
There are several options available for meta-analysis pre-registration. First, a time-stamped meta-analysis protocol following PRISMA-P guidelines can be uploaded to Open Science Framework.
Second, if the meta-analysis investigates a health-related outcome, it can be pre-registered at PROSPERO. The PROSPERO website guides the researcher through a step-by-step registration form, which is used to generate a pre-registration record. These records can be amending, but any changes are timestamped.
Third, a meta-analysis protocol can be submitted for peer-review at a number of journals, such as Systematic Reviews. While the peer-review process obviously takes more time than uploading a protocol, it can provide important feedback that can improve the meta-analysis.
Fourth, a meta-analysis can be submitted using the Registered Report format, in which the meta-analysis is reviewed in two stages. In the first stage, the meta-analysis introduction and methods sections are peer-reviewed before data collection. If the study rationale and methodological approach is deemed appropriate, the journal will provide provisional acceptance of the final paper.

Once the data is collected and analyzed, the paper is submitted again for the second stage review which includes with the same introduction and methods as stage one, but with the addition of results and conclusions. In the second stage of review, the focus is on whether the results and interpretation are in line with the pre-approved method.
Importantly, paper acceptance is not contingent on the statistical significance of results. As of August 2018, there are 42 journals that offer Registered Report meta-analysis, with the majority of these journals publishing research from the biobehavioral sciences.
Publication bias
Publication bias is a well-recognized issue in meta-analysis. As statistically significant studies are more likely to be published, it is likely that there are several non-significant studies left languishing in researcher’s file-drawers for any given research area, which cannot contribute to meta-analyses.

Thus, a meta-analysis summary effect size may not best represent the “true” effect size. A common approach to assess the risk of publication is to construct a funnel plot, which plots effect sizes against a measure of variance (e.g., standard errors). A symmetrical funnel plot is indicative of low risk of publication bias. Despite the inherent subjectivity of visually inspecting a funnel plot to assess evidence of asymmetry, many researchers still rely on this tool.
Now let’s return to our imaginary study. As our fictitious researcher was aware of issues with subjective funnel plot assessments, they objectively assessed asymmetry by constructing a funnel plot. As researchers are poor at identifying asymmetry from funnel plots, they followed recommendations and performed Egger’s regression test to complement the funnel plot (Fig. 1A).

A statistically significant test is indicative of funnel plot asymmetry. In this case, the test was not statistically significant (p = .19). Thus, our researcher concluded that there was no risk of publication bias. A closer look at the data, however, reveals that this conclusion was most likely incorrect.
A common misunderstanding of funnel plots and their associated tests is that they measure publication bias, when in fact they measure small study bias. This type of bias might include publication bias, but it also encompasses other types of bias commonly associated with small studies, such as study quality.
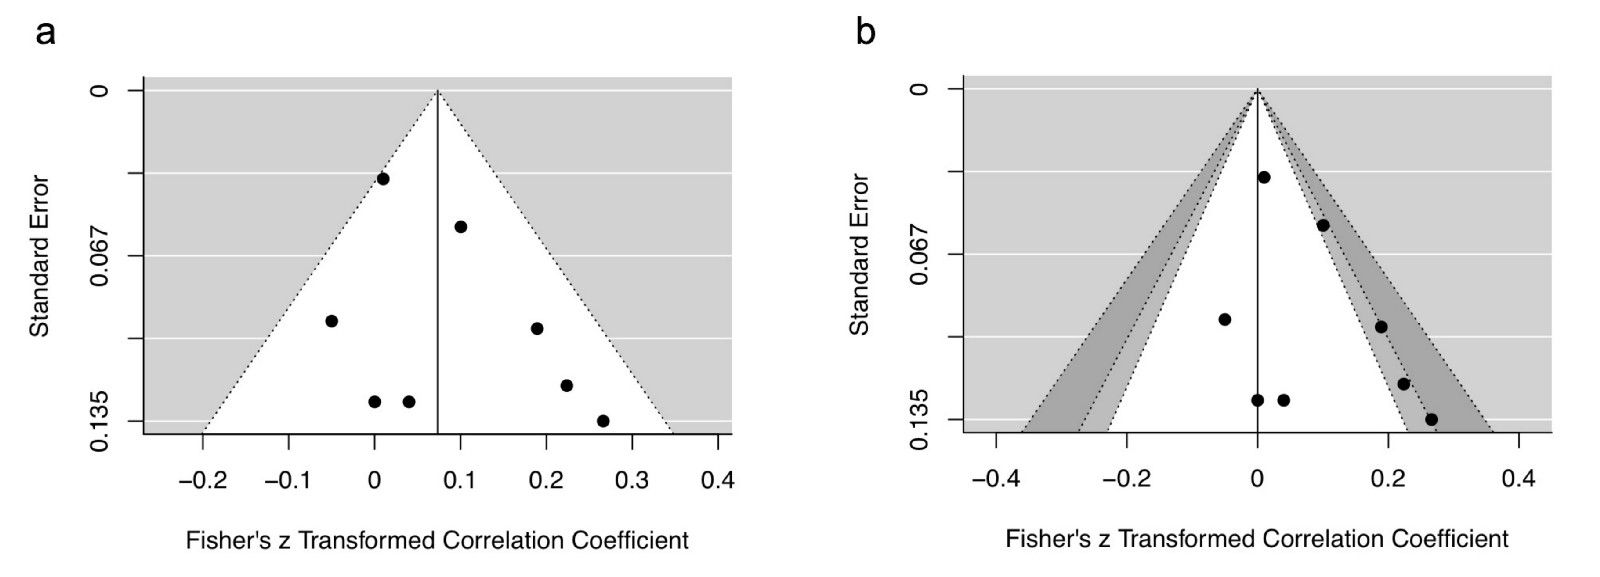
A relatively simple funnel plot modification, called a contour-enhanced funnel plot, can help better understand the risk of publication bias compared to small study bias. For a given range of effect sizes and variances, it is possible to calculate levels of statistical significance at every point. As a result, it is possible to visualise ranges of statistical significance (e.g., p = .05 to .01) on a funnel plot.
Comparing our original funnel plot (Fig. 3A) with a contour-enhanced funnel plot (Fig. 3B) reveals that despite no apparent evidence of funnel plot asymmetry, half of the included effect sizes had p-values were very close to .05. It is highly improbable that half of the available p-values would lie so close to .05. Either these significant studies were also the result of selective analyses or there are several unpublished studies that exist.
Several measures have developed to correct for bias in meta-analysis, such as p-curve, p-uniform, and the three-parameter selection model, with the latter demonstrating superior performance. But without access unpublished research these methods will always be estimates, at best. One plausible solution to this scenario is to conduct a meta-analysis that only includes pre-registered empirical studies, such as the recent meta-analysis on “power posing” from Gronau and colleagues.

Statistically dependent effect sizes
Now to our final common issue in meta-analysis: effect size dependence. Notice that in the earlier meta-analysis example there were eight effect sizes but only seven studies? This was due to two effect sizes being extracted from study four (Fig. 1A). This is a common occurrence as papers sometimes report several outcome measures.
However, as these effect sizes were derived from the same study population they are statistically dependent. As typical meta-analysis procedures assume that effect sizes are statistically independent, combining dependent meta-analyses can lead to biased results.
There are several approaches to for addressing statistical dependency in meta-analysis. First, you can simply choose one effect size per study. While straightforward, a pre-specified system is required to help select the chosen effect sizes, otherwise it can be tempting to simply choose the largest effect. What’s more, this approach excludes potentially valuable effect sizes from your analysis. To include more than one effect from a study, it is possible to statistically aggregate effects. But to do this, you need to include a measure of within-study correlation, which is almost never reported in papers.
If the paper contains raw data, an occurrence which is almost as rare, within-study correlations can be calculated. Therefore, researchers almost always need to estimate within-study correlations if this approach is to be taken. Alternatively, robust variance estimation can be used to account for effect size dependency without a need to know within-study correlations.
Meta-analysis is an important tool for better understanding often disparate research areas. This method can provide a more objective summary of a research area than simply “vote counting” the number of significant and non-significant results.
But like almost any statistical tool, meta-analysis can facilitate inaccurate inferences if used inappropriately. With this post, I hope to have provided a brief overview highlighting some common issues in meta-analysis and practical solutions to these problems.
This is an edited version of an article published in Psykologisk Tidsskrift NTNU, a psychology magazine run by students at the Norwegian University of Science and Technology. Here is a citable preprint of the article and the R script and data to perform the analyses described in this post are available here. My thanks to the Editor of Psykologisk Tidsskrift NTNU for kindly providing permission to repost this article as a blog post.